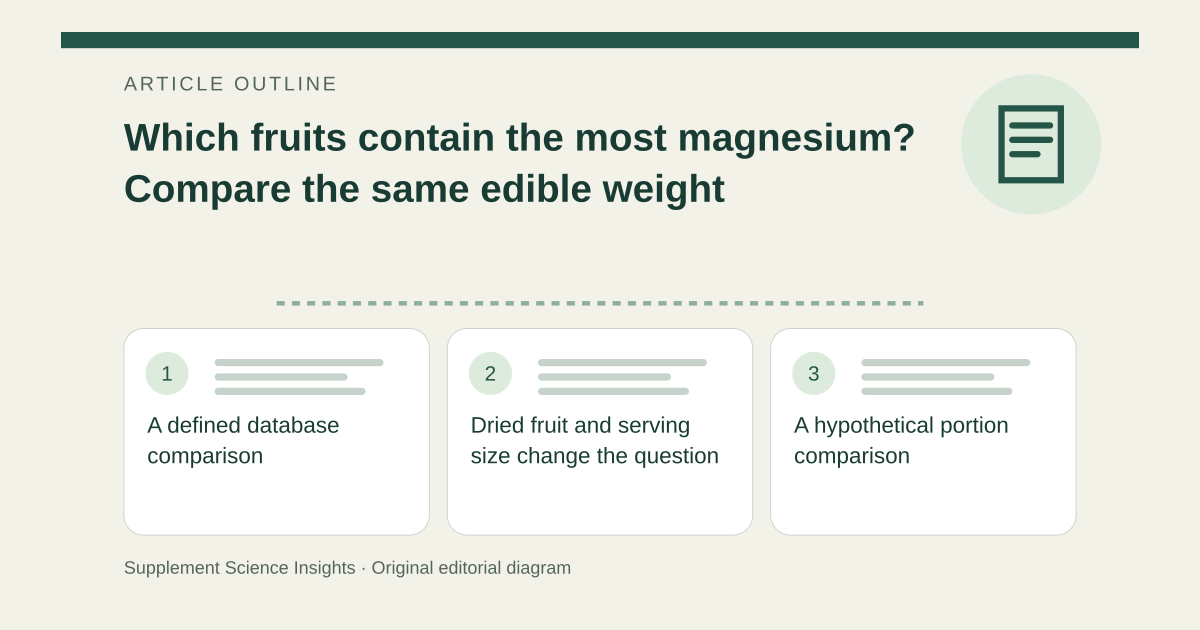
A defined database comparison
Among the raw fruit entries examined in USDA SR Legacy 2018, tamarind has 92.0 mg magnesium per 100 g and prickly pear 85.0 mg. For comparison, all-commercial-variety avocado has 29.0 mg, banana 27.0 mg, green kiwi 17.0 mg, orange 10.0 mg and apple with skin 5.0 mg. This is a comparison of named records, not a worldwide ranking of every cultivar. [1]
Dried fruit and serving size change the question
Dried uncooked figs have 68.0 mg magnesium per 100 g, but that is a dried-food entry, not fresh figs. Likewise, 100 g tamarind pulp may not be your usual portion. The fruit with the highest concentration is not necessarily the one supplying the most magnesium in the amount you actually eat. [1]
A hypothetical portion comparison
A 20 g amount of tamarind pulp calculates to 18.4 mg magnesium, while a 118 g reference banana provides 31.9 mg. The lower-concentration fruit supplies more in this chosen comparison because the portion is much larger. Weigh edible material and keep fresh and dried descriptions separate when estimating intake. [1]
| Edible fruit portion | Estimated magnesium |
|---|---|
| Tamarind pulp, 20 g | 18.4 mg |
| Banana, 118 g | 31.9 mg |
Sources for this article
- USDA FoodData Central — SR Legacy April 2018 food composition dataset
Source consulted: 2026-09-20. This is a reference resource, not a claim that we conducted the studies or tested a product.